



Core Web Vitals are three measures Google uses to judge how a page feels to the person reading it: how fast the main content appears, how quickly the page responds to a tap, and whether things jump around while it loads. Writers rarely touch the code, yet most of what slows a blog post down is something a writer added.
This post explains each measure in plain words, shows the scores that count as good, and lists the habits that keep your own posts fast.
What the three Core Web Vitals measure #
Each measure answers one question a reader would ask if they could.
- Does the page show up soon? That is the largest contentful paint, the moment the biggest image or text block on the screen appears.
- Does it react when I tap? That is Interaction to Next Paint, or INP. It times the gap between a click or tap and the next change on the screen.
- Does it stay still? That is Cumulative Layout Shift, or CLS. It adds up how far things move while the page is still loading.
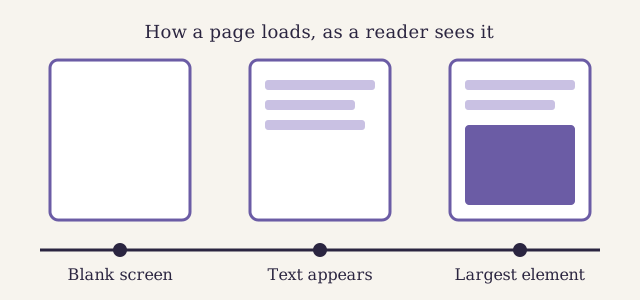
The largest contentful paint is the third frame: the moment the biggest element on the screen has arrived.
The scores that count as good #
Google groups each score into good, needs improvement and poor. A page passes when most real visits score good. The table shows the line for good, from the Web Vitals guide on web.dev.
| Measure | What it times | Good score |
|---|---|---|
| LCP | The largest element appears | In 2026, 2.5 seconds or less |
| INP | The page answers a tap | In 2026, 200 milliseconds or less |
| CLS | The layout stays still | In 2026, 0.1 or less |
The scores come from real visits, not from a test on your own laptop. Google takes the score that three visits in four beat, so the slowest quarter of your readers decides the result.
Why writers move these scores more than they think #
A developer sets up the template once. A writer adds new things to it every week: a lead image, a chart, an embedded video, a quote from a social network. Each of those is a request the browser must make before the page feels finished.
The biggest one is almost always the lead image. On most posts it is the largest element on the screen, so its size decides the largest contentful paint. A photo saved straight from a camera can be ten times heavier than it needs to be.
Habits that keep a post fast #
These are the habits we ask of every writer at Larkspur. None of them needs a developer.
- Resize before you upload. Match the widest size your template shows, and no more.
- Pick the right format. Use photos as JPEG or WebP and drawings as SVG.
- Describe every image. Alt text costs nothing in speed and helps every reader who cannot see the picture.
- Load embeds only when needed. One video in a post is fine. Four videos and a social feed are not.
- Keep the top of the post light. The first screen should be text and one image, not a slider.
If your blog lets you write an image tag by hand, keep the browser's own lazy loading for images further down the page, and always give the alt text:
Do not lazy load the lead image. It is the one image the reader needs at once, so the browser should fetch it first.
Layout shift, the problem readers notice most #
A page that jumps while you read it is the fastest way to lose trust. You start reading a line, an advert or an image loads above it, and the line moves away from your eyes.
Most layout shift in posts comes from three sources:
- Images without a set size. The browser does not know how much room to keep, so it makes room late.
- Embeds that grow as they load. A video or a social post often starts small and then expands.
- Banners added at the top. A notice that slides in after the page has drawn pushes everything down.
A good template reserves the space for each of these before they load. If your blog shows the width and height of every image, the browser can do the same.
Watch the talk on responsiveness #
The Chrome team explains in this talk from 2024 how to find the slow interactions behind a poor INP score, with examples from real sites.
Our video notes on debugging INP pull out what to check on a blog. This post also has a German version, and our step-by-step guide for a two-language blog shows how the two are tied together.
Check your own Core Web Vitals #
You do not need special tools to see where you stand. Search Console has a Core Web Vitals report that groups your pages by score from real visits. Check it once a month, and look first at the posts with the most traffic.
When a post fails, open it and ask which of the habits above it breaks. In our experience the fix is the lead image four times out of five. Fast pages also help when you mark up a post with structured data, because a page that loads quickly gets crawled and read more often.
Add a speed check to the list we run before every post, so the problem never reaches your readers. And if you write for AI search as well, fast and stable pages are easier to fetch: our research on which pages AI tools choose to quote shows why.